
Optimising electricity costs with modern tools in power quality analysis instruments
Optimising electrical power consumption in an era of rapidly rising power prices has become a necessity for both business and private consumers. Many consumers and prosumers have begun to wonder how they can really make a difference in reducing their electricity bills.
It is important to first precisely identify the sources of potential losses and only then to tackle them. This usually requires a financial expense. The savings generated must compensate for the expenses incurred on optimisation. First of all, it is important to have the right tools to diagnose and monitor specific locations in your electrical system. Sonel meters are such tools.
The Sonel PQM-707 is a three-phase power quality analyser. The Sonel MPI-540 and Sonel MPI-540-PV are multifunctional meters for electrical installation parameters. However, they also feature a three-phase power quality parameter logger implemented on board in a simplified form compared to the Sonel PQM-707. Logging the basic parameters in an electrical system on site, such as current, voltage, active and reactive power and energy flow over time, enables an analysis to build the baseline for acting to reduce the electricity bills. The features integrated into all of these instruments will help to speed up the analysis and make it relevant. All features listed below are among them.
Power loss calculator
An integrated power loss calculator makes it easy to estimate potential costs caused by poor power quality. In addition, the feature’s user is provided with insights into the root causes of the problem. The costs of losses due to wiring resistance, higher harmonics, grid phase imbalance, or reactive power are each calculated separately, in the currency defined in the settings, and for the specified time period. This provides an immediate indication of whether it pays to act and limit financial losses. The calculator estimates the losses for the future based on the parameters specified and monitored.
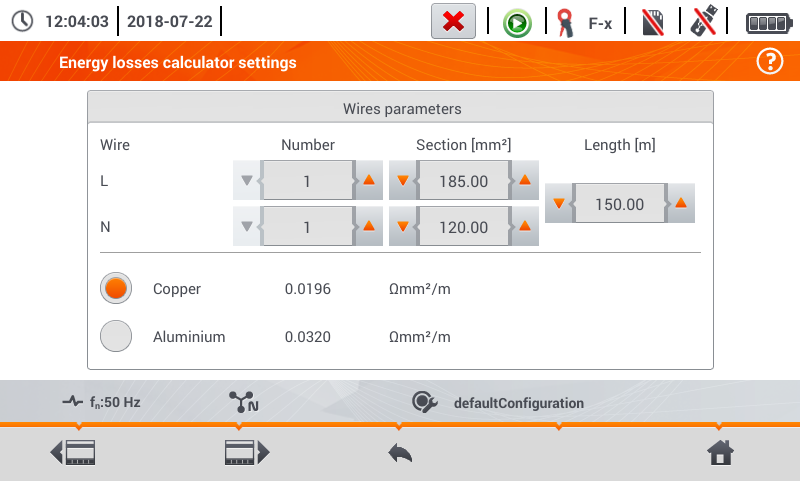
Fig. 1 Power loss calculator – wiring parameter settings
In the first step, the parameters of the supply line such as the number of phases, the wire cross-section, the type of supply materials and the length need to be set up.
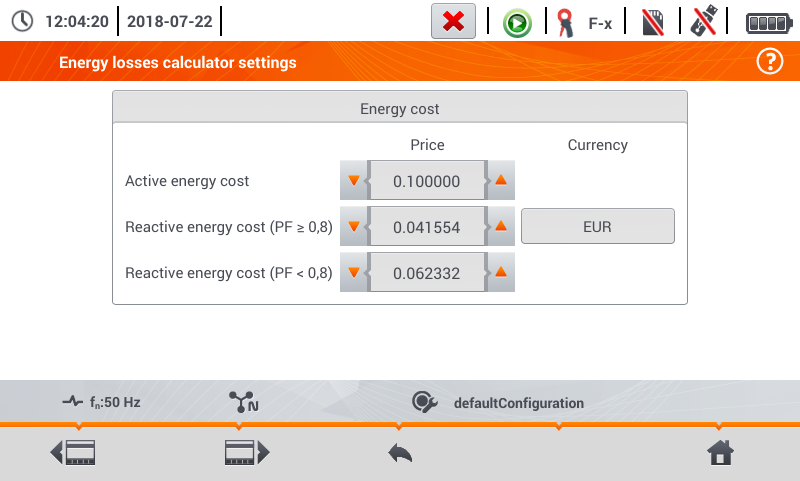
Fig. 2 Power loss calculator – energy cost parameter settings
Then, for a correct estimation of potential losses, the user needs to specify parameters relevant to the user’s costs of electrical power, which include:
- the active power price per 1 kWh;
- the reactive power price per 1 kWh at a power factor PF ≥ 0.8;
- the reactive power price per 1 kWh at a power factor PF < 0.8;
- the currency of billing.
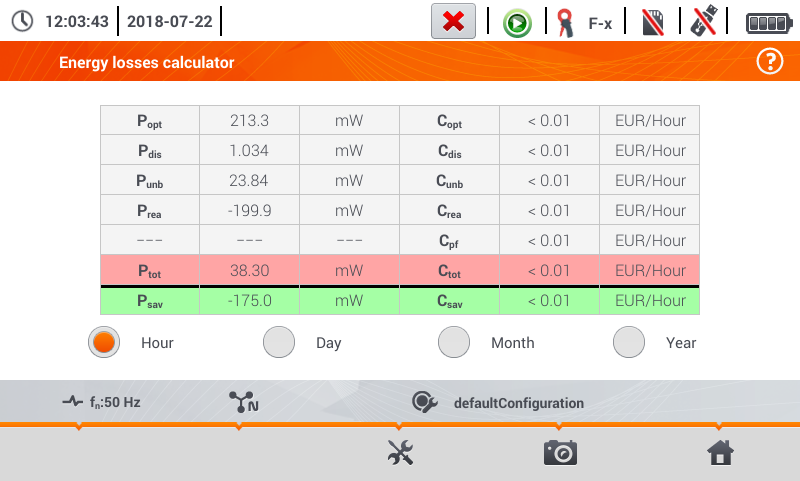
Fig. 3 Power loss calculator – energy cost parameter settings
Based on current readings, the power loss calculator can estimate potential financial losses on an hourly, daily, monthly or annual basis, depending on the options selected. The data is presented to the user in the unit of electrical power and directly in specific amounts of money.
Popt / Copt – power loss / associated costs from wiring resistance (assuming no higher harmonics, phase imbalance or reactive power is present).
Pdis / Cdis – power loss / associated costs from higher harmonics.
Punb / Cunb – power loss / associated costs from grid phase imbalance.
Prea / Crea – power loss / associated costs from reactive power.
Cpf – costs from low power factor (high reactive power share).
Ptot / Ctot – total losses / associated costs (the total of the items above).
Psav / Csav – power losses / associated costs that can be reduced by improving power quality parameters (e.g. compensating for harmonics and removing phase imbalance), expressed from the relation Psav = Ptot – Popt
Note that this is just a tool that can be of great help to the user, but it has its drawbacks and as such, it needs to be used with caution. The estimation is driven by instantaneous values of power quality parameters and is based on the assumption that the same values are maintained for a fixed period of time in the future. The calculator-generated results should therefore be treated as a reference for a deeper analysis that demands logging the power quality parameters over a longer period of time at the location of interest in the electrical system on site to determine if the measured values match the forecast from the power loss calculator. Only when completed can these two steps provide a reason to interfere with the electrical system on site.
Energy cost calculator
This tool enables optimal selection of the billing tariff for the electricity supplied by a specific utility. In contract to the power loss calculator, which is driven on instantaneous values of power quality parameters, the energy cost calculator is a tool which processes the parameters values which have already been logged in a specific period of time. If the logged parameters include active power, Ep, the energy costs can be calculated according to the user-defined billing tariff schedule. If the power utility’s portfolio of services and their pricing are known, the user can input different electricity pricing options and compare them directly.
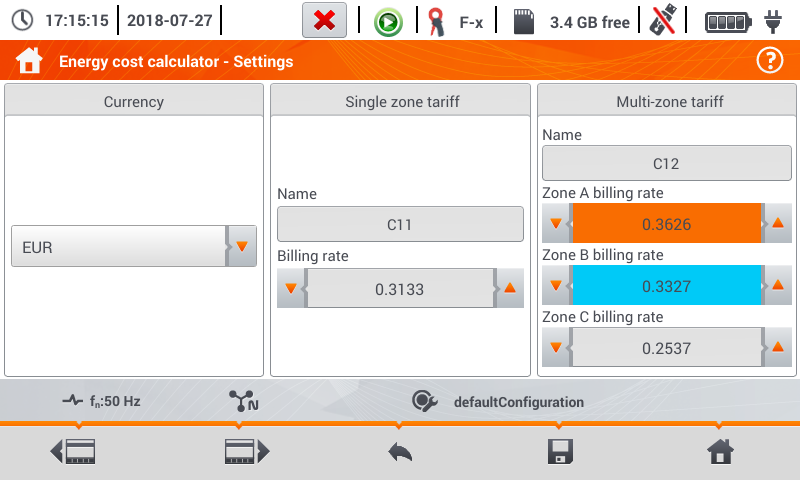
Fig. 4 Energy cost calculator – main settings
A careful observation of the peaks in electrical power consumption and its repeatability can significantly help to select the right tariff from the power utility. For example, important criteria may include weekends or the work shift regime at the user’s business. The basic parameters which need to be input are the rates applicable in the preset tariff zones and the times of tariff zone applicability.
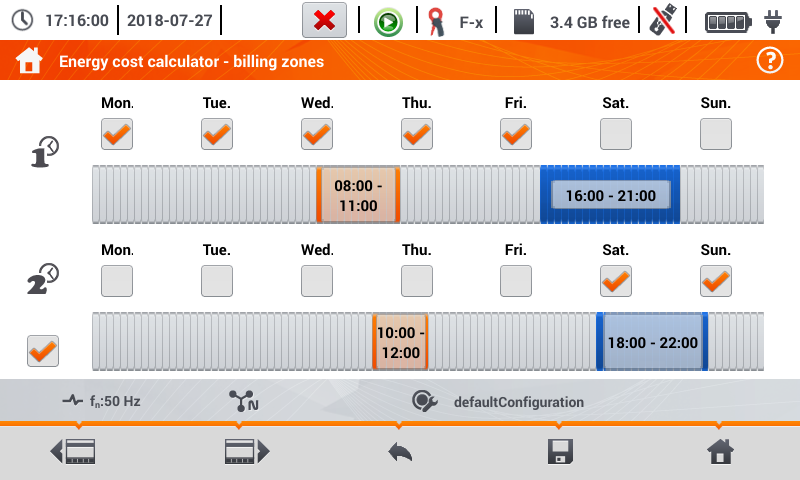
Fig. 5 Energy cost calculator – tariff zone settings
A clear user interface allows the selection of daily and hourly intervals.
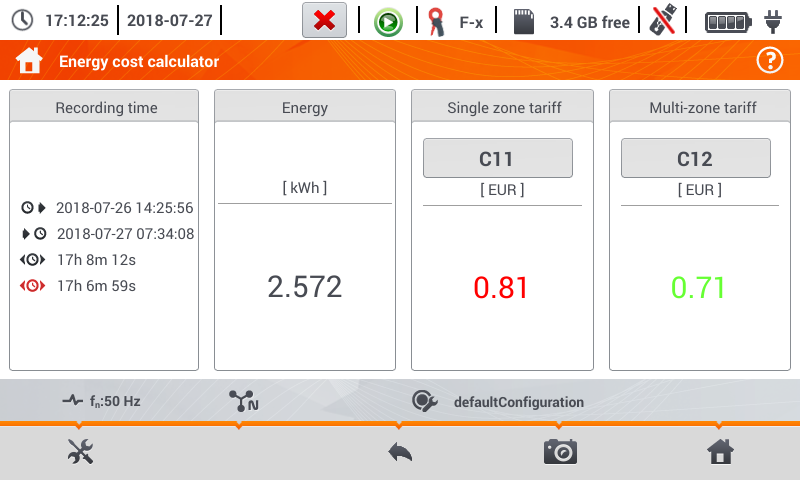
Fig. 6 Energy cost calculator results screen
The results of the comparison defined by the user are displayed directly in the form of the amounts payable for a defined period of time with the specific power billing tariff. This enables an quick assessment to drive an informed decision to which tariff should be switched to. The results include the electrical power consumption in kWh over the time interval which the power quality parameters were logged in. It is important to remember that this applies to active power, without the contribution of high reactive power generation levels to the electricity bills. This matter is covered in the next section.
Reactive power compensation and four-quadrant energy meters
Although this is not a functionality directly integrated in the Sonel PQM-707 and Sonel MPI-540, Sonel MPI-540-PV meters, it is another way to reduce electricity bills by using these instruments. The active power consumed is converted directly into useful operation or performance of connected power loads. Reactive power, on the other hand – although necessary for the proper operation of the grid – if it is excessive, it generates unnecessary costs and compromises the quality parameters of the power supply. Power distribution utilities generally charge for the export of capacitative reactive power into the grid and for exceeding the inductive reactive power limits allowed. An important parameter here is the tgφ factor, which determines the ratio of reactive inductive power to active power.
Exceeding it usually incurs contractual penalty charges. In most cases, the tgφ value should be no higher than 0.4. All the measuring instruments in question have on-board features to record the energy flow using a four-quadrant meter setup, which allows not only to determine the reactive power level, but also its type (inductive or capacitative). This provides the baseline for its compensation through the use of capacitor banks (for inductive reactive power) or compensating reactor/choke banks (for capacitative reactive power).
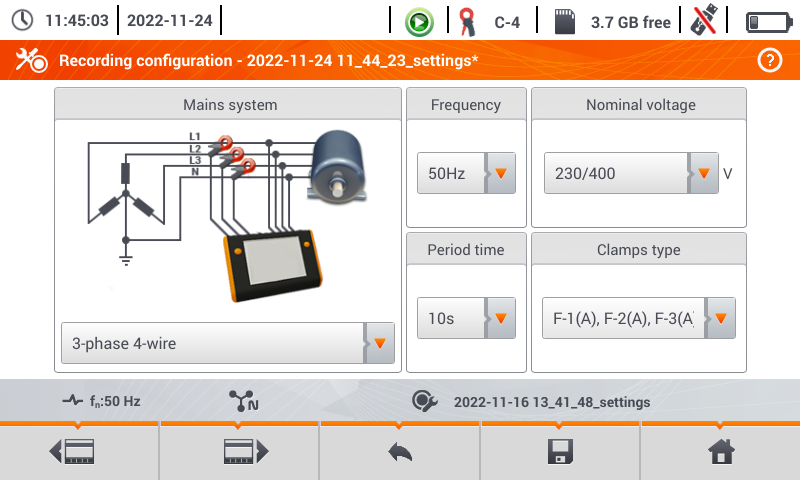
Fig. 7 Logger parameters configuration screen
Before starting to log the parameters, the meter must be properly wired to the electrical system on site using the current clamps supplied as standard with the meter. A simple interface allows configuring different variants of the earthing system and basic parameters.
Increasingly expensive electrical power seems not to be a passing trend. In these conditions, it makes sense to note and verify if electrical consumption in your electrical system is optimised. The tools discussed so are complementary to the instruments and are not the only methods to generate savings. However, you can make the savings real using the functionalities implemented in the Sonel MPI-540, Sonel MPI-540-PV and Sonel PQM-707 meters. Note that if you decide to buy one of them, remember that both instruments have much greater capabilities which should be considered for the measurement and diagnosis. Only the capabilities which can support power cost optimisation are discussed here.
Author: Tomasz Gorzelańczyk, Sonel S.A.
Products mentioned in the article:


No Comment