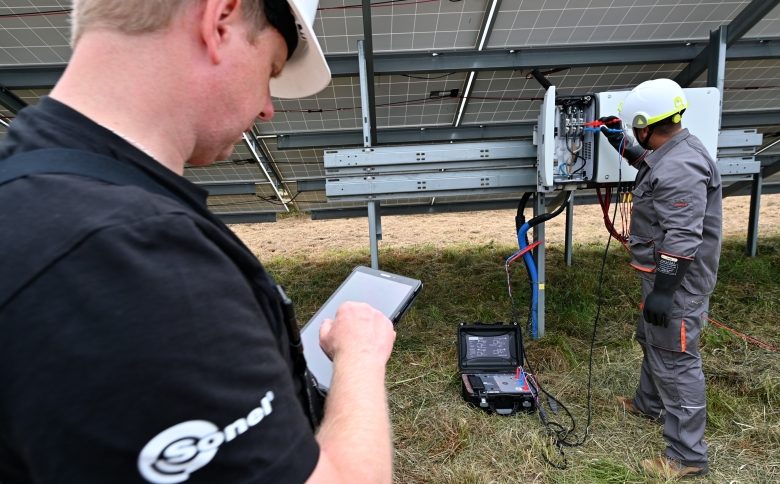
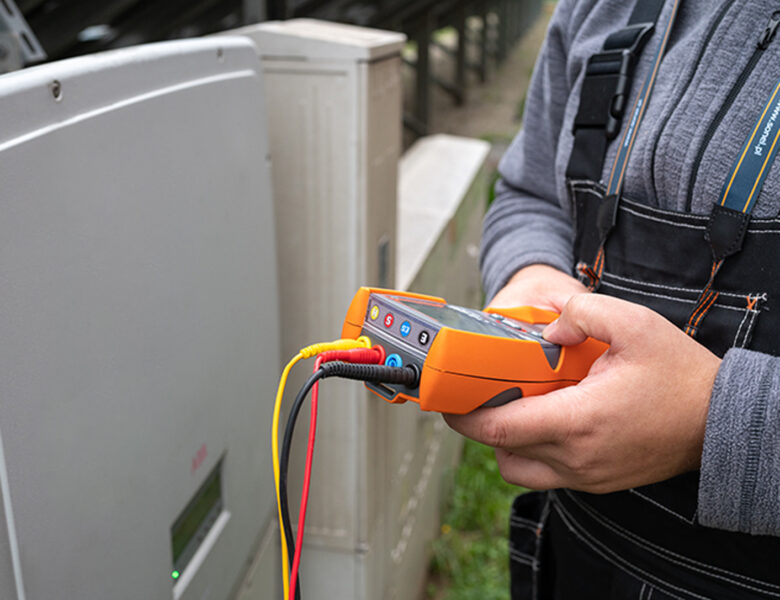
Measurements of Short Circuit Loop Impedance in Photovoltaic Farms in IT Networks at Voltages up to 900 V AC
Loop impedance measurement on photovoltaic farms in IT systems with voltages up to 900 V AC is one of the greatest challenges in modern PV system diagnostics….
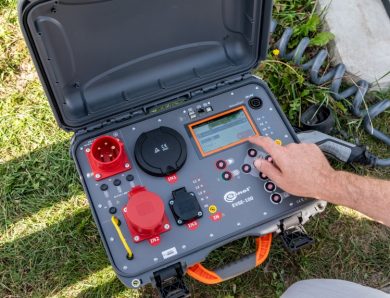
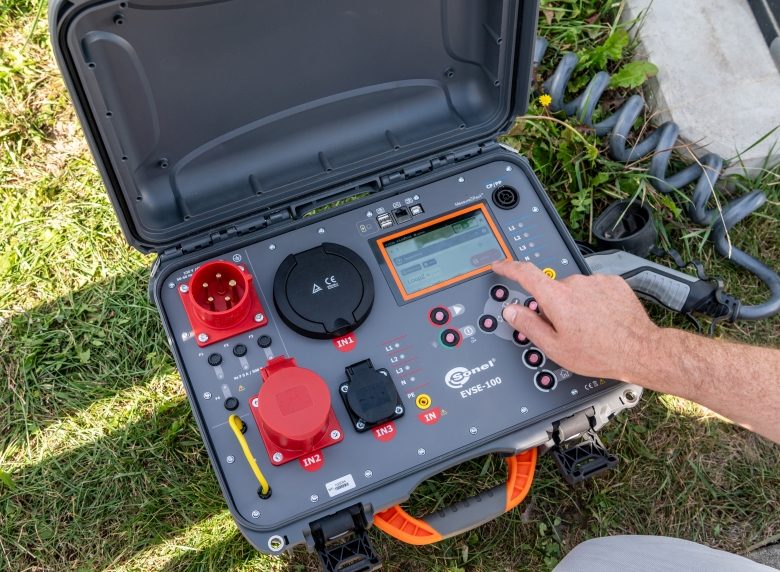
Read moreComprehensive diagnostic testing of electric vehicle charging stations using the Sonel EVSE-100 multifunction analyser
The dynamic growth of electromobility calls for modern diagnostic tools that can ensure the safety and reliability of electric vehicle charging stations. One such solution is the…
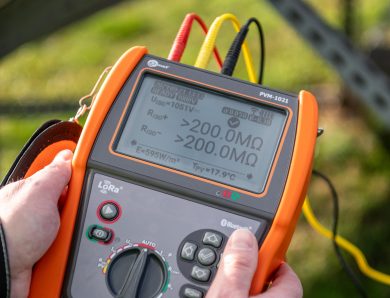
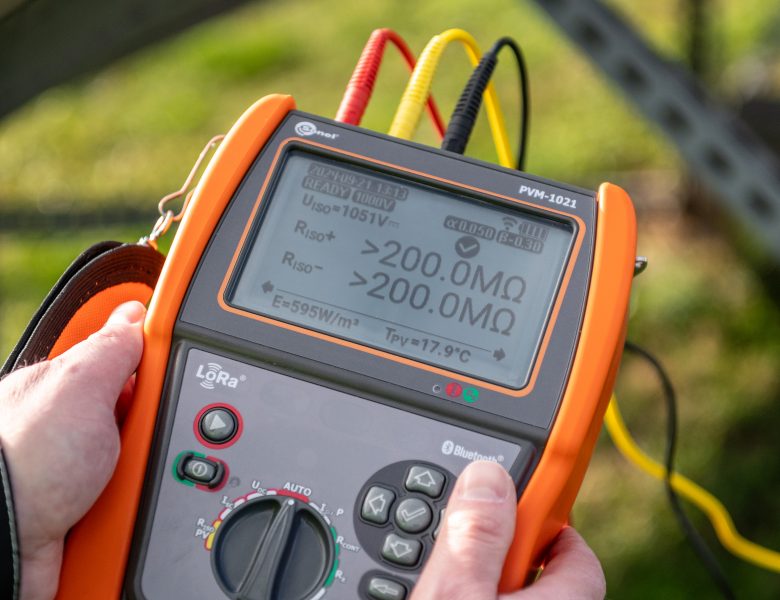
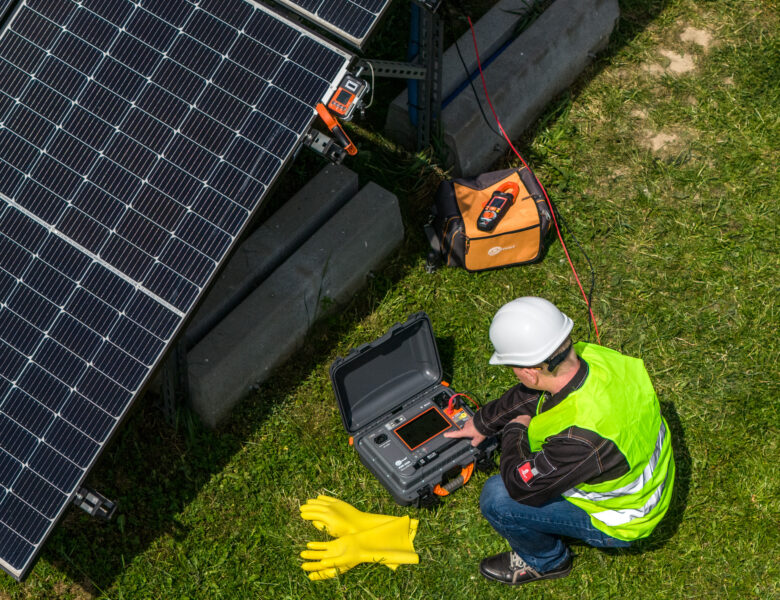
Read moreSafety Measurements of Photovoltaic Systems with the Sonel PVM-1021 Pro Meter
In a world where we are seeing the rapid growth of photovoltaic micro-installations, it is essential to not only ensure their proper installation but also to regularly…
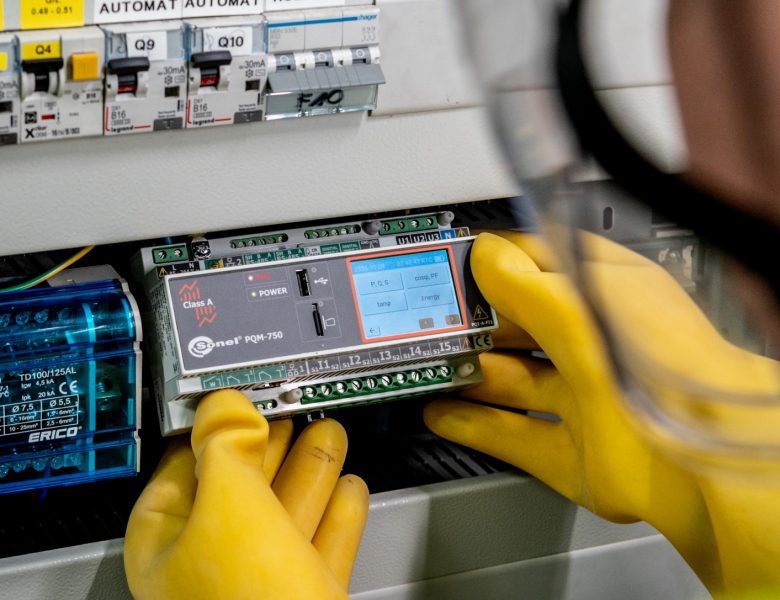
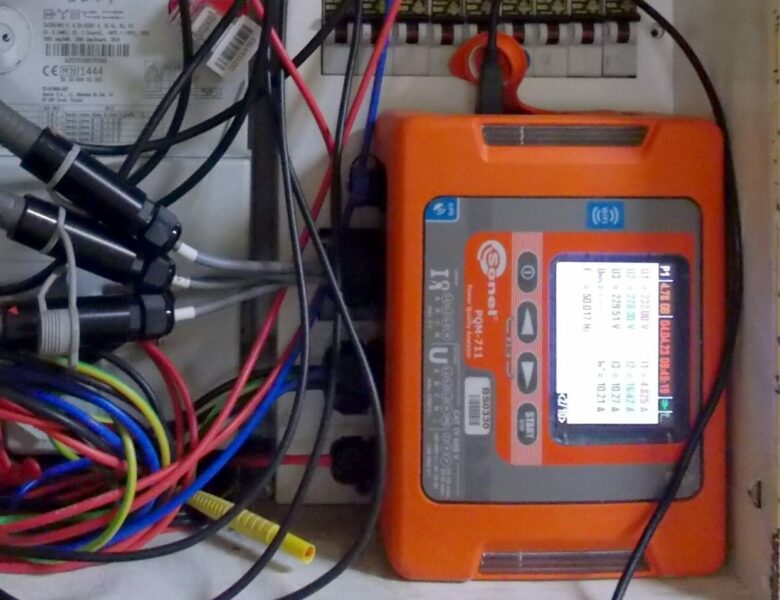
Read moreContinuous power quality monitoring with the Sonel PQM-750 stationary analyser
The PQM-750 analyser is Sonel’s answer to the growing demands of the power market. Developed for precise, continuous monitoring of network parameters, it is distinguished by its…
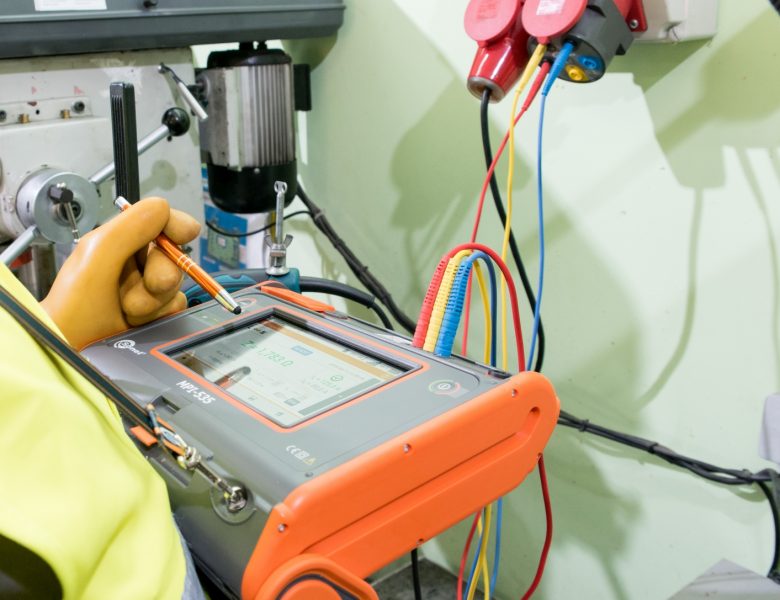
Read moreThe basic model belonging to the Sonel MPI series family of multifunction meters is the Sonel MPI-535. This device combines advanced technology, measurement versatility and ease of…
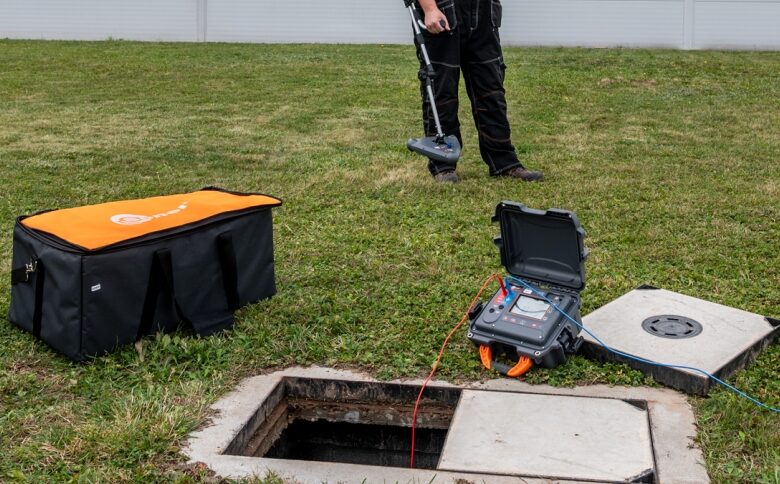
Read moreConstruction and earthworks are increasingly being carried out in locations densely occupied by buried utilities. How to really prevent their damage and avoid costly repairs? One solution…
Read moreDiscover the advantages of the Sonel MRU-12 – a new meter for measuring earth resistance and soil resistivity. The compact structure, durable and robust enclosure, many measurement…
Read moreWith the number of photovoltaic systems on the rise, it is vital to ensure that they are safe and comply with applicable regulations. To meet these needs,…
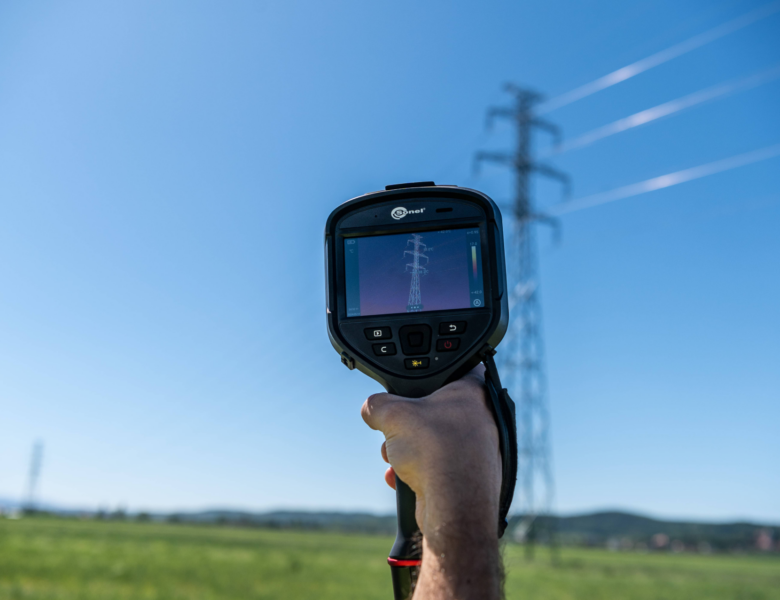
Read moreSee more with the new Sonel KT series 500 cameras
Resolutions from 256 x 192 to 640 x 480, manual and automatic focus, temperature range from -40°C to 650°C, IFOV from 1.70 to 0.68 mrad. Sonel is…
Read moreReactive power compensation: three steps to financial savings
Non-linear loads such as UPSs, computer PSUs, LED lamps, inverters, air conditioners, etc. draw mains current which is distorted and off-phase with voltage. One of the negative…
Read more
