Reducing electricity bills by analysing network parameters
In these days of energy crisis and dwindling resources of fossil fuels, electricity consumers are increasingly looking for ways to reduce their electricity consumption and lower their power bills.
The main measures to reduce electricity consumption are optimisation actions, like turning off unused or idle electrical loads, operating electrical loads in their rated conditions (without under or overloading), and using automatic control to ensure rational operation of electrical equipment (e.g. automatic dusk control for lights). The next step is to install or replace existing appliances with more energy-efficient counterparts, which naturally leads to a reduction in energy consumption. The ultimate solution is the installation of local power supply sources such as photovoltaic systems — preferably when these sources are combined with electrical power storage.
However, it is important to understands that savings are not only about reducing active power consumption, but also about optimising the electrical system for better power quality. A growing share of consumers are paying for reactive power, both inductive and capacitative in nature, as a result of operating modern non-linear loads and poor power quality. It is why it is so important today to be aware, already when purchasing and installing energy-efficient electrical appliances, of the additional charges they may incur.
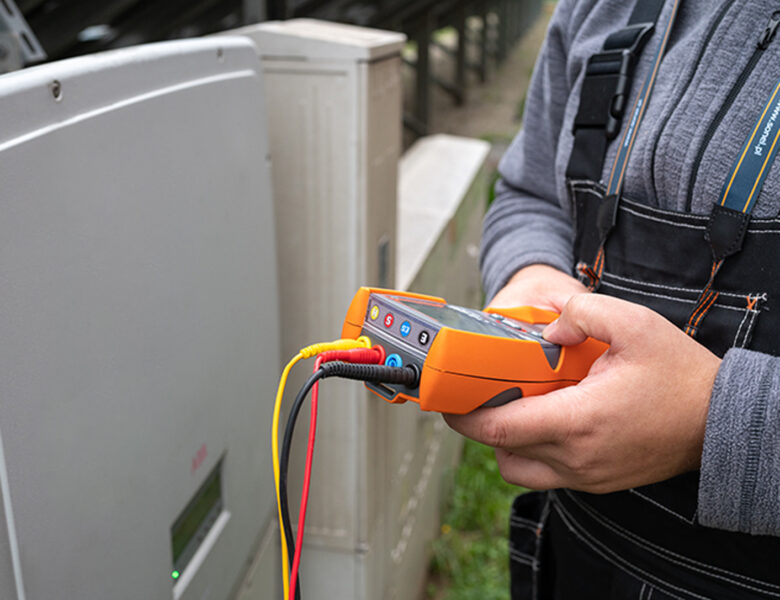
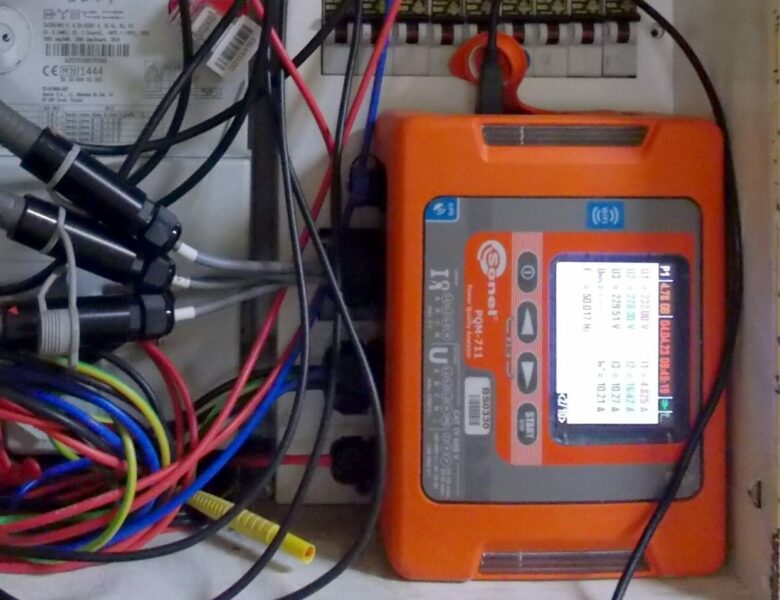
So how can energy consumption and electricity bills be reduced using Sonel PQM-700 / PQM-707 / PQM-710 / PQM-711 analyzers? Well, all you have to do wire up the analyzer in the location to be monitored and measure the power. An analysis the measurements will show a ‘landscape’ of the electrical system with its loads, harmonics, power supply line imbalance and other parameters that can be improved. There are several opportunities for energy and cost savings enabled by this.
It is common for energy consumers to install energy-efficient electrical loads (appliances, equipment, machines, etc.) with a lower demand for active power. This is a pro-sustainability approach, but it can have certain pitfalls. LED lights are an example. They are very energy-efficient light sources, but at the same time, for the overwhelming majority of these products, they are capacitative reactive power sources. Many times you could hear about electricity consumers replacing hundreds of older, incandescent or CF lamps with modern LED ones. The replacement noticeably reduced active energy bills, but at the same time, the capacitative reactive power charge swelled up. And, it can be charged a lot for, as power utilities bill electricity consumers for every kilowatt-hour that a 4-quadrant power meter totals.
To reduce reactive power charges, a mix of inductive and capacitative loads should be operated per power supply phase. If this is not possible, a reactive power compensator can be installed, be it based on static compensation (like chokes or capacitors) or dynamic compensation (power electronic compensators). Figure 1 shows an example of the logged inductive and capacitative reactive power before and after compensation. Before compensation, the capacitative reactive power charges accounted for 10% of the total consumption bill. Thanks to the compensation system, capacitative reactive power charges have decreased by 100% in just one month.
Fig. 1 Plots of inductive (green) and capacitative (red) reactive power
The most important parameters in terms of electricity bills are power and energy. Each consumer has a contract with its power utility that specifies the contracted power. The contracted power specifies the maximum active power the consumption of which the customer shall not exceed in 15-minute billing cycles. If there are penalty charges for excessive active power consumption listed on the electricity bill, generating a load profile for the consumer using the Sonel PQM analyzer, it is possible to quickly detect instances when the contracted power limit is exceeded. By installing energy-efficient equipment and optimising the use of power loads, it is possible to eliminate these penalty charges.
If optimisation is not possible, e.g. due to technological processes, an increase in contracted power can be requested from the utility. This will incur higher fixed charges, but if the power quality analysis points to a reduction of contracted power limit penalty charges, there can be considerable savings. The opposite may apply when the contracted power limit is high and the consumer’s actual power use is disproportionately small. Then, by reducing the contracted power limits, costs can be reduced. Figure 2 shows the load profile of a business that had a contracted power limit of 25.8 kW. The maximum power usage recorded was 8.5 kW. Analytical measurements enabled a reduction of the contracted power limit, which in turn reduced the bills by 6% per year.
Fig. 2 The load profile of a small business
Savings on active power charges can be secured choosing the right electrical power tariff. Again, by having the power consumption data recorded, it is possible to calculate which tariff will provide the best cost efficiency. For many consumers, the simplest 24-hour tariff is usually sufficient. For other consumers, a multi-zone tariff could be a reasonable choice if their load profile has a preference for power consumption in non-peak demand times of day, when the power charges are considerably lower.
It is not unusual to generate savings of several per cent a year just by switching to a more optimised power bill tariff. Note that the Sonel Analysis software included with the Sonel PQM analyzers has an active power tariff calculator feature, which allows the most favourable tariff to be quickly estimated. By analogy, switching to a different power utility can also provide benefits. With little effort, this can result in a further reduction in electricity bills. Figure 3 shows a summary of the active power measurement monthly report for a small retail unit. The load profile shows that switching from a single-zone to a dual-zone tariff will result in annual savings of around 13%.
Fig. 3 Summary of the active power tariff calculator report
In the beginning of this article, the trend of installing local power supply sources — in particular photovoltaic systems — was mentioned. This is a very good project to reduce electricity bills. Unfortunately, a high concentration of micro PV plants in a power grid area often causes serious power quality problems. They usually include violation of the regulatory grid voltage limit and the light flicker index limit. There are several causes of this: from a poor PV inverter setup to an outdated power grid. The biggest problem from the perspective of a PV system owner is the PV inverter shutting down and the lack of active power generation. This results in measurable financial losses.
Using the Sonel PQM series of analyzers, the causes of problems in the system on-site and the grid can be pinpointed. A report was specifically developed for RES systems and is available in the Sonel Analysis software. With measurements done, it can be determined whether the unnecessary generator downtime can be reduced by changing the PV inverter settings for reactive power management. Also, the power utility can use the measurements to operate the necessary switching in the grid or outright plan an upgrade of the power service line. Figure 4 shows an example of overvoltage at a substation which powers a district of standalone homes in a large city. After an analysis of measurements and technical options, some customers with PV systems were switched to another transformer station. This improved the situation, as evidenced by the analyzer measurements.
Fig. 4 Voltage plots for a substation
Author: Marcin Szkudniewski, Sonel S.A.
Products mentioned in the article:
No Comment