Inrush current! Consequences, measurements, analysis

Inrush current! Consequences, measurements, analysis

Unexpected protection failures! Inactivation of devices! Voltage dips! Flickers!

What are inrush currents?

Each device powered by electricity experiences a moment when it begins to draw power from the network, which causes the physical effect of increasing current. Examples include starting the drive under load, starting engine at idle, turning on the lights, activating additional level of capacitors, etc. Depending on the purpose and many additional conditions, transient values of this current are very diverse. The common feature is the current increase until the maximum current is reached and current decrease in until its steady state is achieved. This process takes place in a limited, relatively short period of time.

Differences in current increase process and in the limit value reached depend on several factors: the physical power demand, power supply voltage and design of the connected device. The process of start-up is also affected by the condition and characteristics of the power supply network. Connection conditions take into account network capacity to supply power in a continuous manner at certain power consumption. In addition, they provide reserves for momentary start-up overload, depending on power consumers declared by the recipient. As one of the effects of a short-term, increased demand for power during start-up is a momentary decrease of supply voltage (voltage dip), then a necessary condition to avoid disturbance of power quality is compliance of activated load characteristics with the connection conditions.

Three examples of negative effects of inrush currents

One of the first symptoms of inrush current presence is tripping of overcurrent protection device(s) and switching off the device being activated or the entire branch of power supply line (Fig. 3). This is mainly due to the fact that during the start-up period, larger current is present than the nominal current selected for the protection device or the type of the protection device is unsuitable for the start-up characteristics of the protected equipment. Moreover, a random and simultaneous activation of many smaller devices may take place at the same time. This problem may be detected by statistical parameters of inrush currents, based on recorded waveforms and then appropriate correction of protection device(s) may be introduced.

Fig. 1. Example of transformer switching – Imax 463 A – captured by Sonel PQM-707 analyzer

Other symptoms are voltage dips. During the start-up process, as a result of sudden current increase, network voltage may decrease, particularly in long cable lines or overhead lines (Fig. 5). In some cases, undervoltage protection devices (if installed) may trip in equipment during the initial start-up phase. This type of events may be identified (even with their specific thresholds) if the inrush (start-up) current is recorded together with voltage waveforms during the start-up. The solution is a proper correction of settings in protective devices or a change of power supply to more efficient. Voltage dips caused by start-up process may adversely affect the operation of other devices powered simultaneously from the network. The effects may include the reset of processors and computer equipment. In some cases, the instantaneous voltage dips, as transient events, may be accompanied by dangerous resonance phenomena, which may even damage to connected equipment.

Voltage dips caused by start-ups may repeat several times, causing fast, high-speed voltage fluctuations (Fig. 6). One of the effects of such fluctuations may include changes in light intensity, which affect directly the working comfort and safety of people. To identify the effect of flickering, the sufficient method is observation of lighting. In contrast, to identify the risks caused by voltage fluctuations, it is necessary to use an advanced analyzer and to perform sufficiently long recording.

In conclusion:

  1. Tripping of overcurrent protection device(s) and switching off the device
  2. As a result of the sudden current increase, network voltage may decrease

Fig. 2. Table of accumulated exceedances of the maximum current

A few simple actions for performing diagnostics and measuring inrush currents

A typical activity in case of problems caused by start-up (inrush) currents is to define the parameters of the start-up, i.e. the range of current and voltage changes during start-up and its duration. If necessary, it may be determined whether the power supply parameters at the connection between provider and consumer meet the requirements specified in standards or contracts. To perform this task, use an analyzer of A Class, i.e. one of the series Sonel PQM-702/PQM-702/703/710/711, which can record the inrush current and power quality report data at the same time. To perform quality measurements and record values of inrush currents, proceed as follows:

1. Prepare record settings of the analyzer for:

  • Recording for compliance with the valid national standard.
  • Activate recording of current exceedances and enter the tripping threshold as a value lower than the value expected during the start-up.
  • Activate the recording of waveforms and RMS(1/2).
  • Set the maximum recording time for waveforms at 1s and for RMS (1/2) at 30 sec.
  • Send the settings to the analyzer.

2. Connect the analyzer and activate recording.

3. Stop recording after collecting sufficient number of disturbances caused by inrush currents. The number of events is limited by the available measurement memory.
4. Read the records using Sonel Analysis software and archive them.

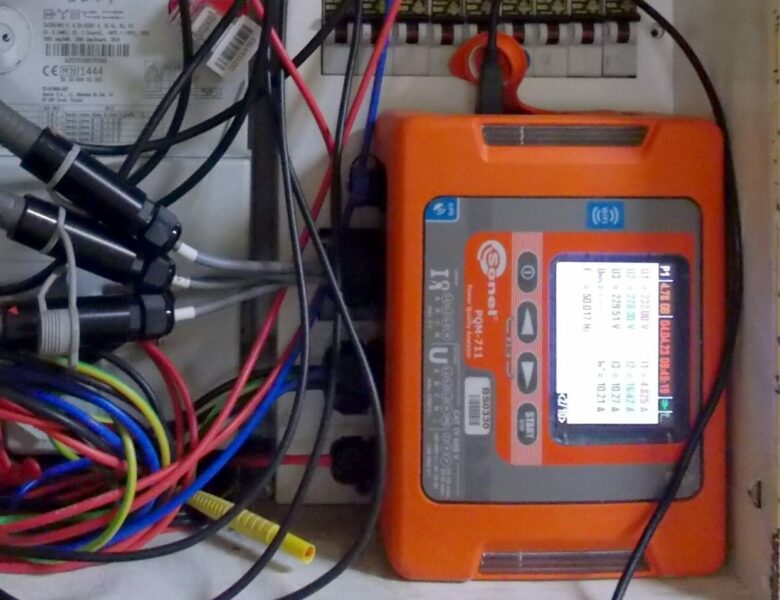
In everyday maintenance of industrial plants, when voltage disturbances caused by inrush currents are highly disruptive, it is recommended to use Sonel PQM-707 analyzer. It is the analyzer with a 7” touch screen;. It has a dedicated function for recording inrush currents (Fig. 1) of a maximum duration up to 60 seconds and with calculation of the Joule integral value, which is useful when setting overcurrent protection.

Define the following during the configuration:

  1. The value of maximum current, above which the start-up begins.
  2. Nominal current of the tested device, which indicates the end of the start-up process.

This function enables the user to record individually successive disruptions, creating a collection of inrush current events. The analysis of events is immediate and takes place directly in the meter.

Fig. 3. Inrush current Imax = 165 A caused tripping of C16 protection

Analysis of the inrush currents measurement results

Using Sonel Analysis software to analyse recorded current and RMS waveforms, the user may define parameters and effects of inrush currents.

Procedure:

  1. Open the measurement file in ‚events’ tab and select the event with a waveform (Fig. 2).
  2. Set markers 1, 2 and 3 on the waveform in its characteristic points. Read the relevant instantaneous values and durations (Fig. 4a).
  3. On RMS(1/2) timeplot find and read RMS values (Fig. 4b).
  4. In measurements tab select active average voltages and currents, as well as maximum voltages and minimum currents, display the timeplot (Fig. 5).
  5. Find the timeplots of flicker factor (Pst) and maximum currents to determine voltage fluctuations (Fig. 6).
  6. Take the appropriate decisions to correct effects of the start-up.

Fig. 4a. Inrush current – maximum 82 A of 1kVA transformer activation

Fig. 4b. Inrush current – RMS(1/2) duration ~10 ms

Half-period effects of inrush currents, presented above, are typical side effects of activating high-power devices. The maximum reached values are dozens of times higher than the RMS value in the steady state, however, the amount of energy determined by the Joule integral often exceeds the protection-tripping values. Therefore, a detailed analysis of recorded inrush currents is a very effective tool for solving problems.

The flicker effect caused by inrush currents is less common, but much more cumbersome. When every large increase of power causes instantaneous deep voltage dip and this event occurs repeatedly at short intervals (Fig. 5.), then a significant increase of Pst factor (and consequently Plt) is evident (Fig. 6). This confirms unambiguously the relation of power quality parameters with the occurrence of inrush currents.

Fig. 5. Current increases during start up of 280 A cause voltage dips of more than 30 V

Fig. 6. Regular activation of a machine every 5s (Iavg=20 A, Imax=380 A), fluctuation of flicker factor (Pst) above 6 (permissible <1)

Author: Krzysztof Lorek

Products mentioned in the article:

Related Posts

Professional measurements of PV systems up to 1500V with Sonel PVM-1530 Pro kit

Professional measurements of PV systems up to 1500V with Sonel PVM-1530 Pro kit

See more with the new Sonel KT series 500 cameras

See more with the new Sonel KT series 500 cameras

Reactive power compensation: three steps to financial savings

Reactive power compensation: three steps to financial savings

Measuring short circuit loop impedance at solar photovoltaic farms and power plants

Measuring short circuit loop impedance at solar photovoltaic farms and power plants

No Comment

Leave a Reply

Your email address will not be published. Required fields are marked *